# Getting Started With CodePerf and Go
After writing benchmarks and generating profiles with Go, you can upload your benchmark data to CodePerf as part of your CI workflow.
This documentation page will show you how to get a simple Golang project up and running with benchmarks and code profiling with CodePerf. You can view the entire source code of this post at our example repository (opens new window).
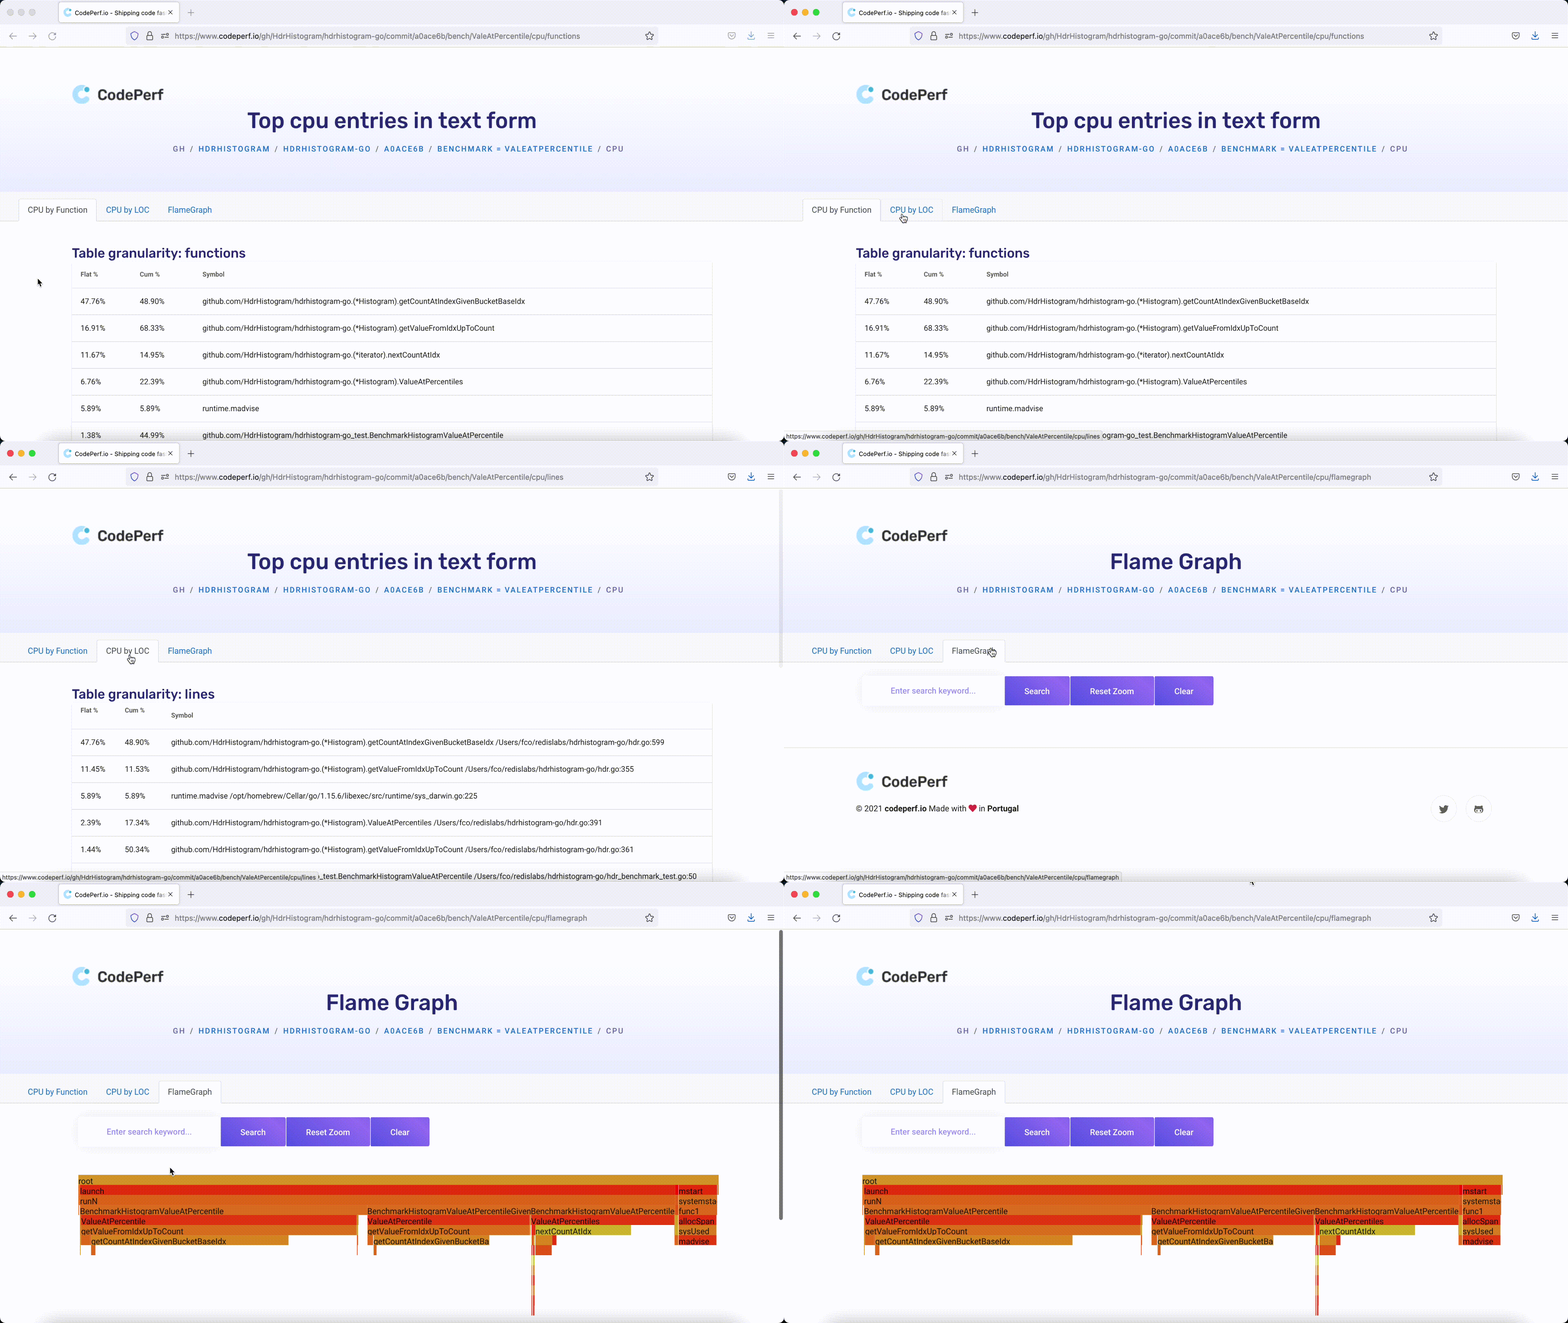
Here's a sample profile output that you check LIVE here (opens new window)!

# Writing the benchmark
We'll start by adding a file named "fib.go" with the following function defined:
package example_go

func Fib(n int) int {
	if n < 2 {
		return n
	}
	return Fib(n-1) + Fib(n-2)
}
After, we create a "test_fib.go" file and add a benchmark to it:
package example_go

import "testing"

func BenchmarkFib10(b *testing.B) {
	// run the Fib function b.N times
	for n := 0; n < b.N; n++ {
		Fib(10)
	}
}
You should be able to test locally that the benchmark is running as expected, and producing the desired profile as follow:
go test -bench=BenchmarkFib10 -cpuprofile profile.out
After the benchmark ran, you should have an output similar to this one:
go test -bench=BenchmarkFib10 -cpuprofile profile.out
goos: darwin
goarch: arm64
pkg: codeperfio/example-go
BenchmarkFib10-8   	 1949052	       605.2 ns/op
PASS
ok  	codeperfio/example-go	2.084s
# Uploading to CodePerf
Now that we are able to run benchmarks locally, we can begin uploading these reports to CodePerf.
# Installing CodePerf's Go bash uploader
We'll upload the profile to codeperf.io by taking advantage of CodePerf's bash uploader to do this -- codeperf (opens new window). If you already codeperf bash utility skip to the next step. You can install the latest bash uploader using the following bash command:
bash <(curl -s https://raw.githubusercontent.com/codeperfio/codeperf/main/get.sh)
# Uploading the profile with codeperf
The only required arguments to push the data to codeperf is the benchmark name ("--bench" argument) and the profile output. You can upload the generated profile.out to codeperf.io, as follows:
codeperf --bench BenchmarkFib10 profile.out
For a deeper understanding of the tweaks you can do, just codeperf --help
# Automated Github Actions Integration
We will not go into detail about setting up a pipeline, given the above section describes all steps in detail, but CodePerf will work with any CI/CD. Below, we show you basic configurations for GitHub Actions.
name: Benchmark and push to CodePerf

on: [push, pull_request]

jobs:
  profile:
    runs-on: ubuntu-latest
    steps:
      - uses: actions/checkout@v2
        with:
          fetch-depth: 2
      - uses: actions/setup-go@v2
        with:
          go-version: '1.17'
      - name: Run Benchmark
        run: go test -bench=BenchmarkFib10 -cpuprofile profile.out
      - name: Get pprof
        run: go install github.com/google/pprof@latest
      - name: Check pprof is available on path
        run: pprof --help
      - name: Get CodePerf Go utility
        run: bash <(curl -s https://raw.githubusercontent.com/codeperfio/codeperf/main/get.sh)
      - name: Upload profile data to CodePerf
        run: codeperf --bench BenchmarkFib10 profile.out
After running the action you should have a link with the profile data viewer. If you follow that link, you should see all benchmarks.
Here's a sample one: https://www.codeperf.io/gh/codeperfio/example-go/commit/32b2a50/bench/BenchmarkFib10/cpu (opens new window)